I want to discuss the last chart from yesterday’s a little more.
To review, the trends of rented, owned, and vacant homes all follow remarkably linear paths in the last half of the 20th century, before each breaks down, in turn.
As I wrote yesterday, don’t take the linear trend too seriously. It’s a bit of a trick of the eye. It is really a trend that should be roughly exponential, but has been growing at a slowing rate. And, that will probably continue. And, its continuation won’t necessarily remain linear.
But, in the meantime, it’s a decent starting point. And, it’s a good visual indication of the scale of the scar 2008 left on the American housing market.
I have used various approaches to come up with rough estimates of the pent up demand there is for new homes, which tend to end up in the 15 million to 20 million unit range. That’s roughly what it would take to get all three categories of home back up to the linear trend line.
In the meantime, to maintain a parallel course with the linear trendlines, we need about 300,000 vacancies, 550,000 rental units, and 950,000 owned homes annually. That’s 1.8 million. Plus some number of homes are lost or demolished, so some additional number is required to replace them. In 2024, including both site built and manufactured homes, we were at about 1.7 million.
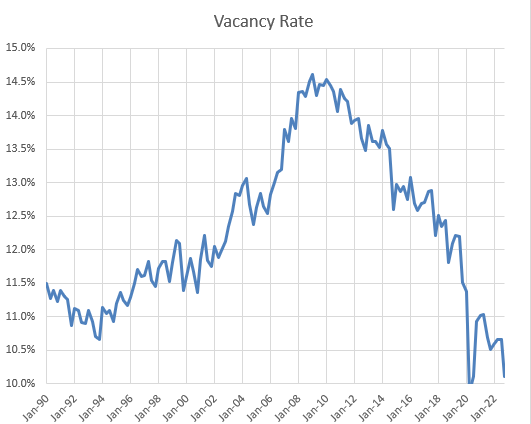
The linear trend must be pretty accurate, because vacancies are sort of the thermometer here. They will rise and fall as a result of the relative sustainability of the production of occupied units. Vacancies declined throughout the 2010s. They only just flattened out from 2020-2024. This data is relatively noisy, so it takes some time to note new trends, but so far in 2025, the number of vacancies does appear to finally be rising. So, we are in the ballpark of a sustainable construction rate.
It seems as though some estimates of a shortage are primarily based on an estimate of vacancies. That is weird to me. That basically assumes that the demand curve for housing is vertical. We need x number of homes, and if we build one extra, it will be vacant, with no other changes in housing consumption.
The same simple-minded reasoning was behind the pre-2008 bubble mania. I’ve shared this quote from Ed Leamer to the Federal Reserve officials in 2007 several times, from his widely cited “Housing is the business cycle” paper:
The inevitable effect of those rates (KE: rates that he thought were too low before 2006) has been an acceleration of the home building clock, transferring building backward in time from 2006-2008 to 2003-2005. Our Fed thus implicitly made the decision: more in 2003-2005 at the cost of less in 2006-2008. That strikes me as a very risky choice. The historical record strongly suggests that in 2003 and 2004 we poured the foundation for a recession in 2007 or 2008 led by a collapse in housing we are currently experiencing.
As if housing demand is on a tightrope and calamity befalls us if the supply of homes changes by even a percentage point. I just don’t understand how this can be the way that leading economists think.
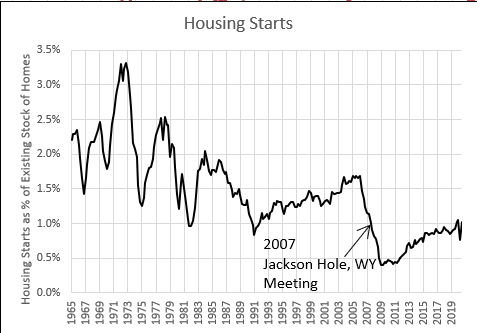
Figure 2 shows the rate of new housing construction over time and the point in time where Leamer told the Fed that a housing glut had pushed us off the demand tightrope and into an inevitable recession.
Rental vacancies had risen from 2000 to 2004, but they weren’t rising anyplace where construction was booming. Then, vacant homes for sale had risen from 1.4 million units in 2005 to 2.1 million units when Leamer spoke at Jackson Hole. Then, in 2007 and 2008, about 2 million vacancies accumulated as a result of the housing bust – homes left unrepaired or held off the market, etc.
So, there were never any vacancies associated with a building boom. You can see that very clearly in the Nevada chart from the previous post. Rental vacancies from before housing construction started to collapse were not associated with hot markets and the other vacancies were caused by the crash. The Fed had been purposefully trying and succeeding in slowing down housing construction for nearly two years when they met at Jackson Hole in 2007.
So the tightrope theory of housing demand didn’t even match the facts on the ground.
The vacancy rate had risen moderately from the 1990s level, from about 11.5% during the 1990s to around 12.5% during the building boom. Most analysts model the market as if there was a glut then. I have argued that the early 2000s vacancy rate was the cyclically neutral rate because it marks the tipping point in rent inflation. Rent inflation has been excessive when the vacancy rate has been below 12.5% and moderate when it has been above it.
(Actually, rent inflation spiked temporarily in 2006 and 2007 when vacancies spiked because those vacancies were a product of the chaos of the self-inflicted housing bust. Then it moderated as the foreclosure crisis, unemployment, and declining incomes moved housing demand lower than the newly low housing supply. Then, after 2014, when the vacancy rate had settled back to about 12.5%, rent inflation took off again.)
Note, though, that vacancies didn’t rise above the long-term linear trend in Figure 1 during the boom years. Thinking of it this way, and referencing Figure 1, you could say that the moderately higher vacancy rate in 2005 was due to the low number of occupied rental units rather than an unusual increase in vacant units. One way to think about that is that the markets with endemic housing shortages (and low vacancy rates) were shrinking.
So, going forward, there is probably a relatively stagnant single-family homeowner market that will be capped at about 1 million units annually by limited mortgage access. Some combination of apartments and single-family homes will be constructed for 600,000 renters. And, 300,000 additional units will be constructed and occupied while 300,000 existing homes become vacant (which includes for sale, for rent, under repairs, seasonally used, etc.).
This is actually a bit tricky. In the zoned America that we have all lived our lives in, some portion of the aging stock of single-family homes filters into the rental market as a substitute for our shortage of apartments. So, the number of rentals versus owned homes has traditionally been equilibrated by a transfer within the existing stock of homes. Landlords didn’t build many new homes. They built apartments where they could, and small scale landlords traded in old homes.
It is possible that, say, 1.3 million new single-family homes will be constructed for homeowners while 300,000 existing single-family homes transition to rentals. I think this is mainly driven by preferences. There are certain amenities associated with different homes in large cities. Usually new homes require trading off location for other amenities. It may be that some portion of new home buyers prefer the amenities associated with existing homes, and that is the main reason that some of the new home market will increasingly be purpose-built rentals.
It is also the case that, now that we are in this context where single-family build-to-rent neighborhoods are viable, large-scale landlords prefer consolidated projects over scattered sites. I think the growth in single-family rentals will be mostly in new units for the foreseeable future, but in the very long run, it would be possible for the single-family new housing market to settle at an annual sales rate to, say, 1.3 million new owners even while the total number of homeowners only grows by, say, 900,000 annually, and the growth of rental stock would come from older homes transitioning to rentals.
Anyway, while that building happens, I think we’ll see an interesting shift in some historical patterns. As with the vacancy rate issue above, over and over and over again, changes in housing consumption are a result of what we can’t do and are interpreted as a result of doing too much of the things we still can do.
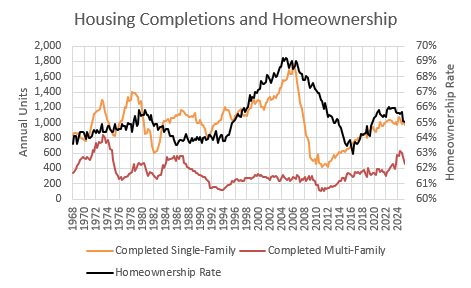
Before the 1990s, building booms included both apartments and single-family homes, so building booms weren’t generally associated with rising homeownership rates.
Then, by the 1990s, there was basically a national cap on apartment construction of about 300,000 units annually, so building booms were limited to single-family units, and so the 2000s boom was associated with a rising homeownership rate.
Then, cutting off millions of families from mortgage access led to fewer single-family homes and a lower homeownership rate. And, when that shock ended the homeownership rate started increasing again. From 2016 to 2023, total construction was unsustainably low, so new homeowners were claiming homes from the existing stock of homes. Apartment construction was still capped. So, household formation among renters had to flatline.
Homeowners were rising in parallel with the long-term linear trend and renter households were flat. That created the rising homeownership rate from 2016 to 2023. The rising homeownership rate was caused by a lack of renter households.
It is common to see respected economists and housing pundits claim that the rising homeownership rate from 2016 to 2023 is evidence that mortgage access hasn’t been so throttled, after all. God, help us.
The new build-to-rent market has been heating up. It’s now set to produce more than 100,000 new units annually. I expect that to grow quickly. There was a spike of apartment permitting after Covid and that led to a few hundred thousand extra apartments, most of which were completed in 2024.
So, since we’re building more rental units, which is allowing more household formation of renters (many of whom should be owners, but aren’t allowed to be), the homeownership rate has turned back down. It peaked at 66.1% in the first quarter of 2023 and it’s dropped to 65.1%. It will continue to drop because now that we have mortgage suppression, building booms will be associated with more rental homes.
It doesn’t really matter whether zoning remains binding so that the new homes are single-family homes or YIMBY wins lead to more apartments. In either case, a building boom will be associated with more renters.
There is still a demographic upward slope in the homeownership rate because older households tend to be owners. But, if the shortage of rental units could be filled today, it would likely be associated with a homeownership rate of something around 61%.
So, what will happen is that the declining homeownership rate will be blamed on private equity home buyers and the new single-family build-to-rent developers. It is already common to hear the complaint that they are pricing out families. The popular solution to stop homeownership from dropping will be to stop building rental housing. There will be old white-haired ladies at all your local land use meetings and state legislature committee hearings who have been long-time passionate warriors for social justice who will demand that we get those greedy SOBs out of the housing market. And an unfortunate number of economists will offer support.
When we do that, the social justice warriors will be happy that the corporations aren’t profiting off of a basic human need. The social darwinists will be happy that the neighborhood next door won’t be full of renters and their own neighborhood will be full of proper families who are qualified to get a mortgage. And it will all be just fine with mutual support from both of them to increase funding for bulldozing the tents out of the park down the street.
Original Post


