
Updated on July 23rd, 2025 by Bob Ciura
Business Development Companies, otherwise known as BDCs, are highly popular among income investors. BDCs widely have high dividend yields of 5% or higher.
This makes BDCs very appealing for income investors such as retirees. With this in mind, we’ve created a list of BDCs.
You can download your free copy of our full BDC list, along with relevant financial metrics such as P/E ratios and dividend payout ratios, by clicking on the link below:

We typically rank stocks based on their five-year expected annual returns, as stated in the Sure Analysis Research Database.
But for investors primarily interested in income, it is also useful to rank BDCs according to their dividend yields. This article will rank the 15 highest-yielding BDCs in our coverage universe.
Table of Contents
Why Invest In BDCs?
Business Development Companies are closed-end investment firms. Their business model involves making debt and/or equity investments in other companies, typically small or mid-size businesses. These target companies may not have access to traditional means of raising capital, which makes them suitable partners for a BDC. BDCs invest in a variety of companies, including turnarounds, developing, or distressed companies.
BDCs are registered under the Investment Company Act of 1940. As they are publicly-traded, BDCs must also be registered with the Securities and Exchange Commission. To qualify as a BDC, the firm must invest at least 70% of its assets in private or publicly-held companies with market capitalizations of $250 million or below.
Another unique characteristic of BDCs that investors should know before buying is taxation. BDC dividends are typically not “qualified dividends” for tax purposes, which is generally a more favorable tax rate. Instead, BDC distributions are taxable at the investor’s ordinary income rates, while the BDC’s capital gains and qualified dividend income is taxed at capital gains rates.
The following section ranks the 20 highest-yielding BDCs in the U.S. that are covered in the Sure Analysis Research Database. The stocks are ranked in order of lowest dividend yield to highest.
High-Yield BDC #15: Main Street Capital (MAIN)
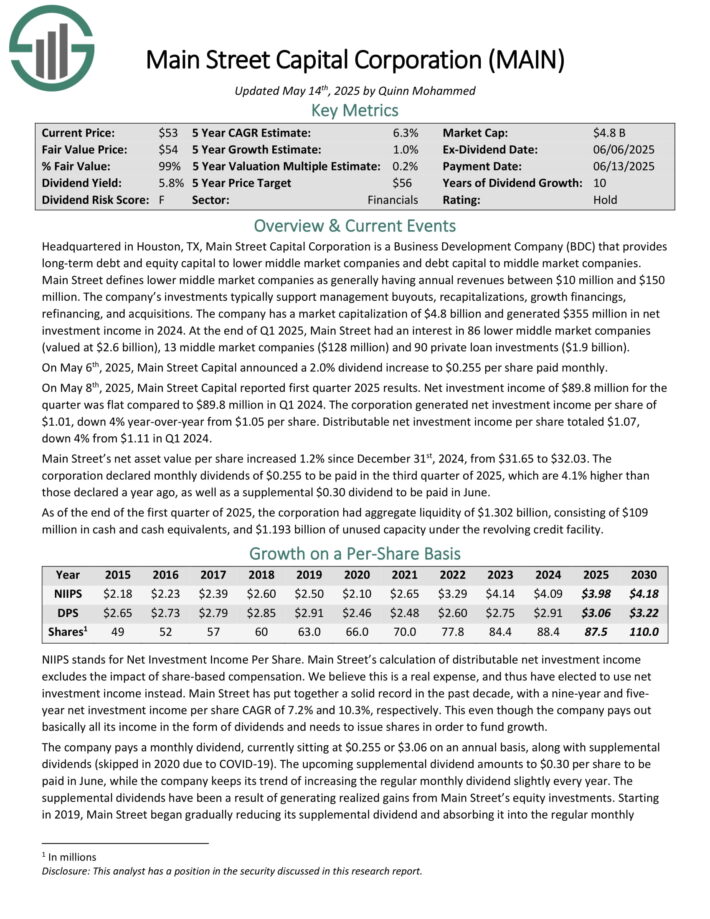
Main Street Capital provides long-term debt and equity capital to lower middle market companies and debt capital to middle market companies.
Main Street defines lower middle market companies as generally having annual revenues between $10 million and $150 million. The company’s investments typically support management buyouts, recapitalizations, growth financings, refinancing, and acquisitions.
At the end of Q1 2025, Main Street had an interest in 86 lower middle market companies (valued at $2.6 billion), 13 middle market companies ($128 million) and 90 private loan investments ($1.9 billion).
On May 6th, 2025, Main Street Capital announced a 2.0% dividend increase to $0.255 per share paid monthly.
On May 8th, 2025, Main Street Capital reported first quarter 2025 results. Net investment income of $89.8 million for the quarter was flat compared to $89.8 million in Q1 2024. The corporation generated net investment income per share of $1.01, down 4% year-over-year from $1.05 per share.
Distributable net investment income per share totaled $1.07, down 4% from $1.11 in Q1 2024. Main Street’s net asset value per share increased 1.2% since December 31st, 2024, from $31.65 to $32.03.
The corporation declared monthly dividends of $0.255 to be paid in the third quarter of 2025, which are 4.1% higher than those declared a year ago, as well as a supplemental $0.30 dividend to be paid in June.
Click here to download our most recent Sure Analysis report on MAIN (preview of page 1 of 3 shown below):
High-Yield BDC #14: NewtekOne Inc. (NEWT)
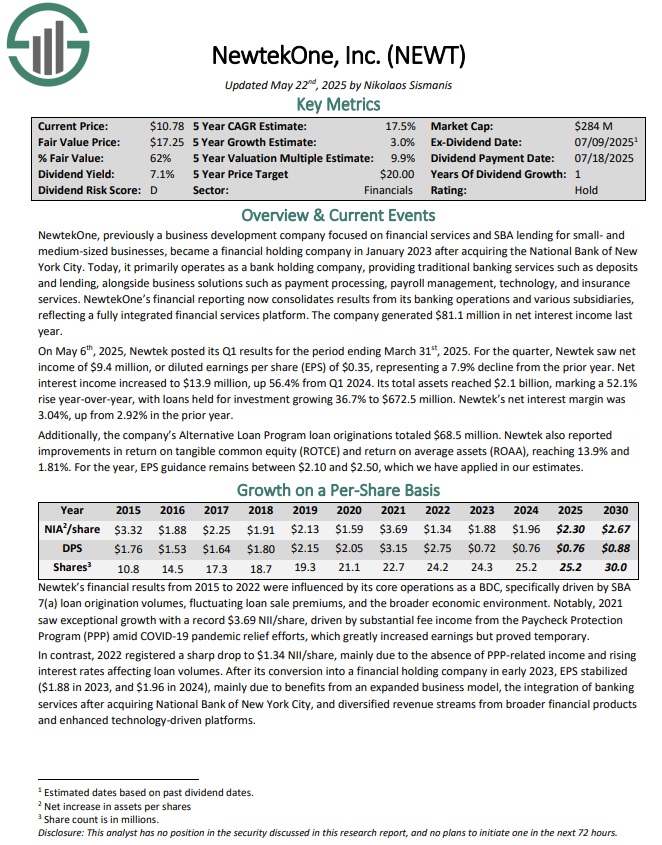
Newtek One provides financial and business services to the small- and medium-sized business market in the United States.
The company also gets a significant amount of its income from being an issuer of SBA (Small Business Administration loans), which only very few BDCs are licensed to do.
On May 6th, 2025, Newtek posted its Q1 results for the period ending March 31st, 2025. For the quarter, Newtek saw net income of $9.4 million, or diluted earnings per share (EPS) of $0.35, representing a 7.9% decline from the prior year.
Net interest income increased to $13.9 million, up 56.4% from Q1 2024. Its total assets reached $2.1 billion, marking a 52.1% rise year-over-year, with loans held for investment growing 36.7% to $672.5 million. Newtek’s net interest margin was 3.04%, up from 2.92% in the prior year.
Click here to download our most recent Sure Analysis report on NEWT (preview of page 1 of 3 shown below):
High Yield BDC #13: Gladstone Investment (GAIN)
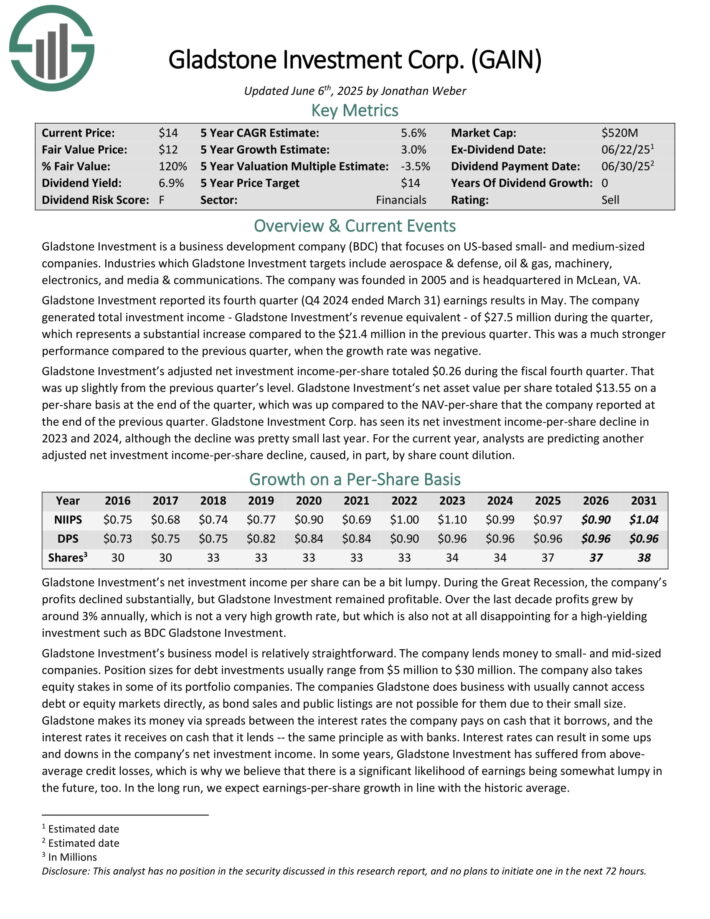
Gladstone Investment is a business development company (BDC) that focuses on US-based small- and medium-sized companies.
Industries which Gladstone Investment targets include aerospace & defense, oil & gas, machinery, electronics, and media & communications.
Gladstone Investment reported its fourth quarter (Q4 2024 ended March 31) earnings results in May. The company generated total investment income – Gladstone Investment’s revenue equivalent – of $27.5 million during the quarter, which represents a substantial increase compared to the $21.4 million in the previous quarter.
This was a much stronger performance compared to the previous quarter, when the growth rate was negative. Gladstone Investment’s adjusted net investment income-per-share totaled $0.26 during the fiscal fourth quarter. That was up slightly from the previous quarter’s level.
Gladstone Investment Corp. has seen its net investment income-per-share decline in 2023 and 2024.
For the current year, analysts are predicting another adjusted net investment income-per-share decline, caused, in part, by share count dilution.
Click here to download our most recent Sure Analysis report on GAIN (preview of page 1 of 3 shown below):
High Yield BDC #12: Gladstone Capital (GLAD)
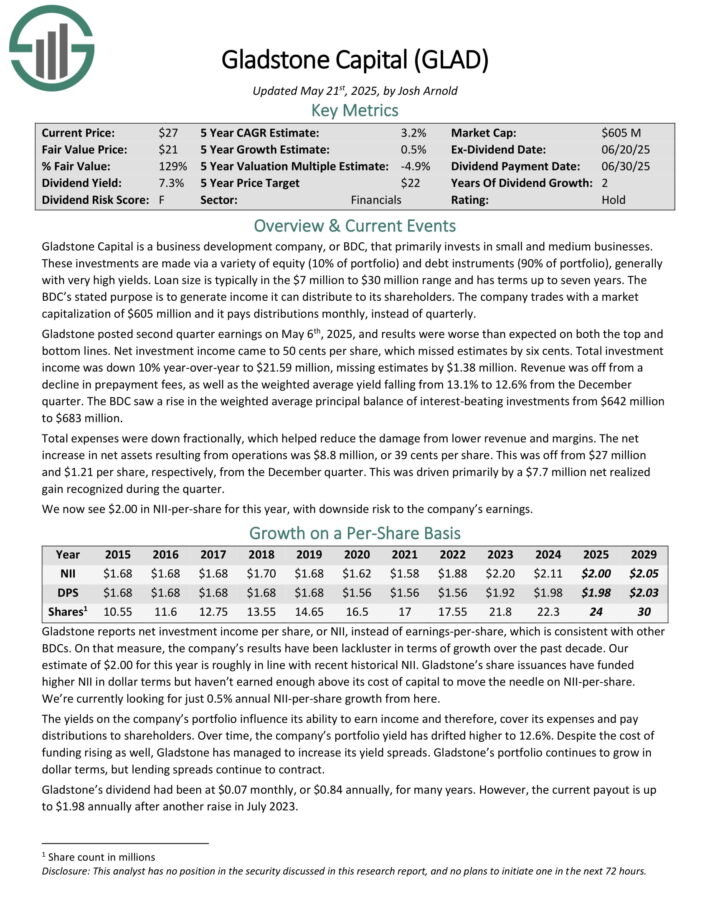
Gladstone Capital is a business development company, or BDC, that primarily invests in small and medium businesses. These investments are made via a variety of equity (10% of portfolio) and debt instruments (90% of portfolio), generally with very high yields.
Loan size is typically in the $7 million to $30 million range and has terms up to seven years.
Gladstone posted second quarter earnings on May 6th, 2025, and results were worse than expected on both the top and bottom lines. Net investment income came to 50 cents per share, which missed estimates by six cents. Total investment income was down 10% year-over-year to $21.59 million, missing estimates by $1.38 million.
Revenue was off from a decline in prepayment fees, as well as the weighted average yield falling from 13.1% to 12.6% from the December quarter. The BDC saw a rise in the weighted average principal balance of interest-beating investments from $642 million to $683 million.
Total expenses were down fractionally, which helped reduce the damage from lower revenue and margins. The net increase in net assets resulting from operations was $8.8 million, or 39 cents per share.
This was off from $27 million and $1.21 per share, respectively, from the December quarter. This was driven primarily by a $7.7 million net realized gain recognized during the quarter.
Click here to download our most recent Sure Analysis report on GLAD (preview of page 1 of 3 shown below):
High-Yield BDC #11: Sixth Street Specialty Lending (TSLX)
SLRC is a Business Development Company that primarily invests in U.S. middle market companies. The company has five core business units which include cash flow, asset-based, life science lending, equipment finance, and corporate leasing.
The trust’s debt investments primarily consist of cash flow senior secured loans, including first lien and second lien debt instruments. It also offers asset-based loans including senior secured loans collateralized on a first lien basis by current assets.
On May 8th, 2024, SLR Investment Corp. reported its Q1 results for the period ending March 31st, 2024. For the quarter, total investment income totaled $58.1 million, up 8.5% sequentially.
The increase in total investment income was mainly powered by higher interest income and dividend income from the company’s investments due to higher interest rates and improved financial performance from invested companies.
On a per-share basis, net investment income came in at $0.44, stable sequentially. We continue to forecast NII/share of $1.70 for fiscal 2024.
Click here to download our most recent Sure Analysis report on TSLX (preview of page 1 of 3 shown below):

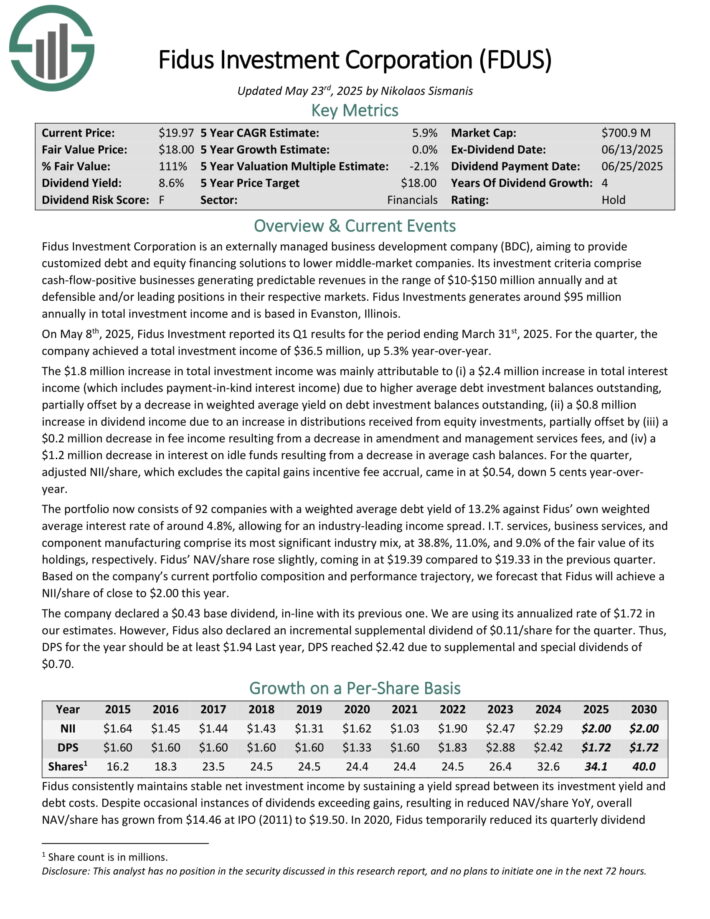
High Yield BDC #10: Fidus Investment Corp. (FDUS)
Fidus Investment Corporation aims to provide customized debt and equity financing solutions to lower middle-market companies.
Its investment criteria comprise cash-flow-positive businesses generating predictable revenues in the range of $10-$150 million annually and at defensible and/or leading positions in their respective markets.
On May 8th, 2025, Fidus Investment reported its Q1 results for the period ending March 31st, 2025. For the quarter, the company achieved a total investment income of $36.5 million, up 5.3% year-over-year.
The $1.8 million increase in total investment income was mainly attributable to a $2.4 million increase in total interest income. This was due to higher average debt investment balances outstanding, partially offset by a decrease in weighted average yield on debt investment balances outstanding.
For the quarter, adjusted NII/share, which excludes the capital gains incentive fee accrual, came in at $0.54, down 5 cents year-over-year.
The portfolio now consists of 92 companies with a weighted average debt yield of 13.2% against Fidus’ own weighted average interest rate of around 4.8%, allowing for an industry-leading income spread. I.T. services, business services, and component manufacturing comprise its most significant industry mix.
Click here to download our most recent Sure Analysis report on FDUS (preview of page 1 of 3 shown below):
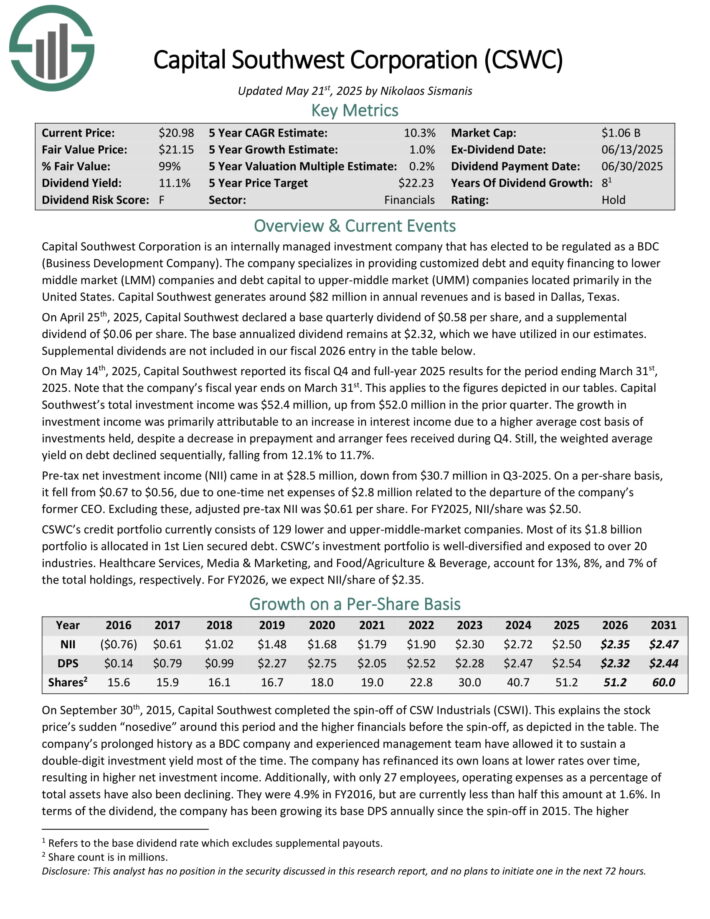
High Yield BDC #9: Capital Southwest Corp. (CSWC)
Capital Southwest Corporation is an internally managed investment company. It specializes in providing customized debt and equity financing to lower middle market (LMM) companies and debt capital to upper-middle market (UMM) companies located primarily in the United States.
Capital Southwest generates around $82 million in annual revenues and is based in Dallas, Texas. On April 25th, 2025, Capital Southwest declared a base quarterly dividend of $0.58 per share, and a supplemental dividend of $0.06 per share. The base annualized dividend remains at $2.32.
CSWC’s credit portfolio currently consists of 129 lower and upper-middle-market companies. Most of its $1.8 billion portfolio is allocated in 1st Lien secured debt. CSWC’s investment portfolio is well-diversified and exposed to over 20 industries.
On May 14th, 2025, Capital Southwest reported its fiscal Q4 and full-year 2025 results. Total investment income was $52.4 million, up from $52.0 million in the prior quarter.
The growth in investment income was primarily attributable to an increase in interest income due to a higher average cost basis of investments held, despite a decrease in prepayment and arranger fees received during Q4. Still, the weighted average yield on debt declined sequentially, falling from 12.1% to 11.7%.
Pre-tax net investment income (NII) came in at $28.5 million, down from $30.7 million in Q3-2025. On a per-share basis, adjusted pre-tax NII was $0.61 per share. For FY2025, NII/share was $2.50.
Click here to download our most recent Sure Analysis report on CSWC (preview of page 1 of 3 shown below):
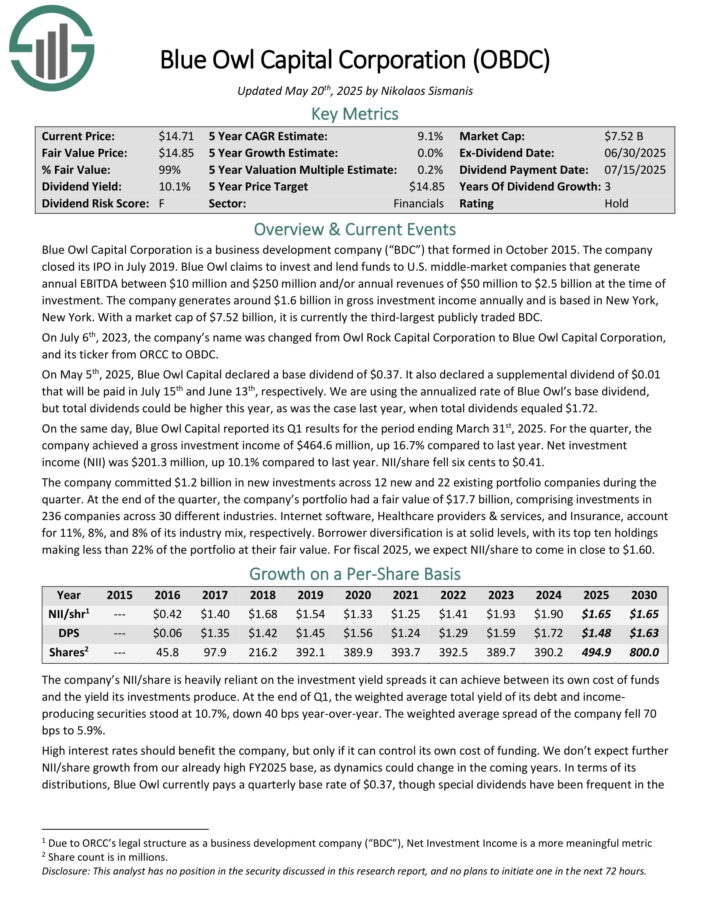
High Yield BDC #8: Blue Owl Capital (OBDC)
Blue Owl Capital Corporation invests and lends funds to U.S. middle-market companies that generate annual EBITDA between $10 million and $250 million and/or annual revenues of $50 million to $2.5 billion at the time of investment. The company generates around $1.6 billion in gross investment income annually and is based in New York, New York.
On May 5th, 2025, Blue Owl Capital declared a base dividend of $0.37. It also declared a supplemental dividend of $0.01 that will be paid in July 15th and June 13th, respectively. We are using the annualized rate of Blue Owl’s base dividend, but total dividends could be higher this year, as was the case last year, when total dividends equaled $1.72.
On the same day, Blue Owl Capital reported its Q1 results for the period ending March 31st, 2025. For the quarter, the company achieved a gross investment income of $464.6 million, up 16.7% compared to last year. Net investment income (NII) was $201.3 million, up 10.1% compared to last year. NII/share fell six cents to $0.41.
The company committed $1.2 billion in new investments across 12 new and 22 existing portfolio companies during the quarter. At the end of the quarter, the company’s portfolio had a fair value of $17.7 billion, comprising investments in 236 companies across 30 different industries.
Internet software, Healthcare providers & services, and Insurance, account for 11%, 8%, and 8% of its industry mix, respectively.
Click here to download our most recent Sure Analysis report on OBDC (preview of page 1 of 3 shown below):
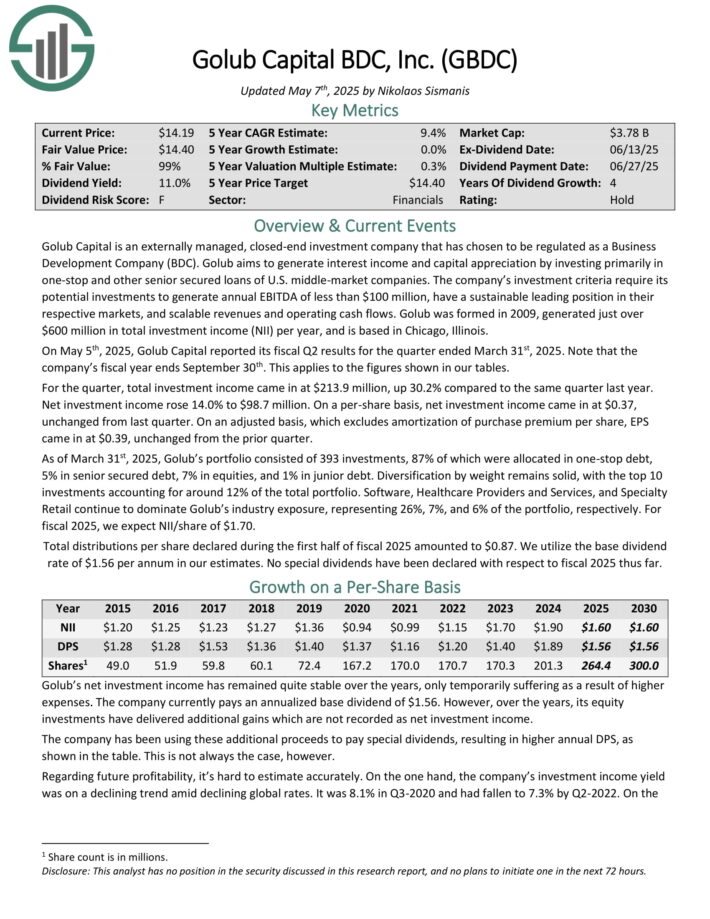
High Yield BDC #7: Golub Capital BDC (GBDC)
Golub Capital is an externally managed, closed-end investment company. It aims to generate interest income and capital appreciation by investing primarily in one-stop and other senior secured loans of U.S. middle-market companies.
The company’s investment criteria require its potential investments to generate annual EBITDA of less than $100 million, have a sustainable leading position in their respective markets, and scalable revenues and operating cash flows.
As of March 31st, 2025, Golub’s portfolio consisted of 393 investments, 87% of which were allocated in one-stop debt, 5% in senior secured debt, 7% in equities, and 1% in junior debt. Diversification by weight remains solid, with the top 10 investments accounting for around 12% of the total portfolio.
On May 5th, 2025, Golub Capital reported its fiscal Q2 results for the quarter ended March 31st, 2025. For the quarter, total investment income came in at $213.9 million, up 30.2% compared to the same quarter last year.
Net investment income rose 14.0% to $98.7 million. On a per-share basis, net investment income came in at $0.37, unchanged from last quarter.
On an adjusted basis, which excludes amortization of purchase premium per share, EPS came in at $0.39, unchanged from the prior quarter.
Click here to download our most recent Sure Analysis report on GBDC (preview of page 1 of 3 shown below):
High Yield BDC #6: Stellus Capital (SCM)
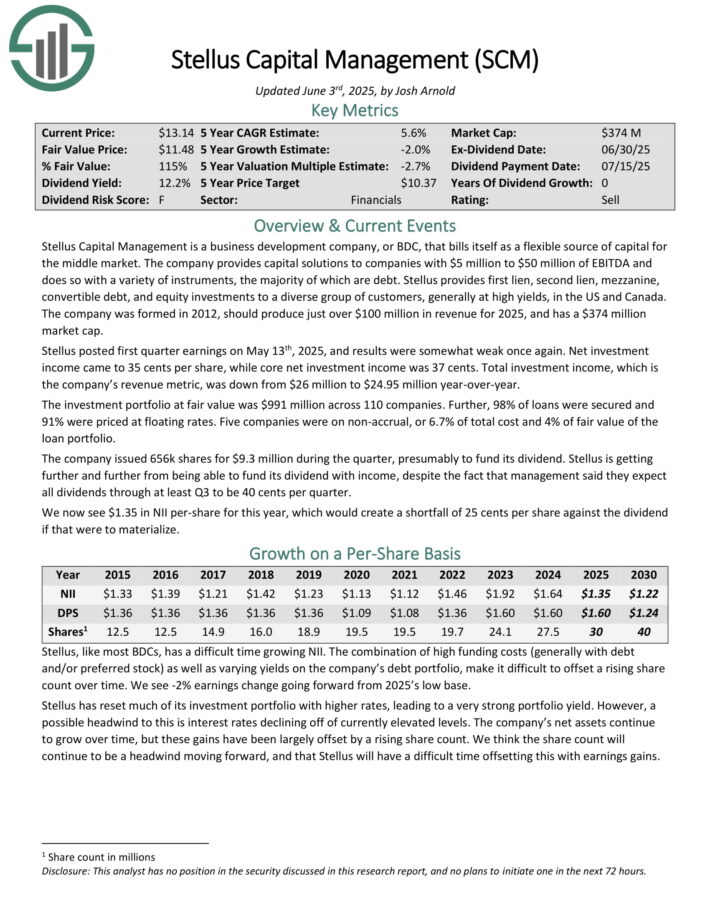
Stellus Capital Management is a business development company, or BDC, that bills itself as a flexible source of capital for the middle market.
The company provides capital solutions to companies with $5 million to $50 million of EBITDA and does so with a variety of instruments, the majority of which are debt.
Stellus provides first lien, second lien, mezzanine, convertible debt, and equity investments to a diverse group of customers, generally at high yields, in the US and Canada.
The company was formed in 2012, should produce just over $100 million in revenue for 2025.
Stellus posted first quarter earnings on May 13th, 2025, and results were somewhat weak once again. Net investment income came to 35 cents per share, while core net investment income was 37 cents.
Total investment income, which is the company’s revenue metric, was down from $26 million to $24.95 million year-over-year. The investment portfolio at fair value was $991 million across 110 companies.
The company issued 656k shares for $9.3 million during the quarter, presumably to fund its dividend. Stellus is getting further and further from being able to fund its dividend with income.
Click here to download our most recent Sure Analysis report on SCM (preview of page 1 of 3 shown below):
High Yield BDC #5: Barings BDC (BBDC)
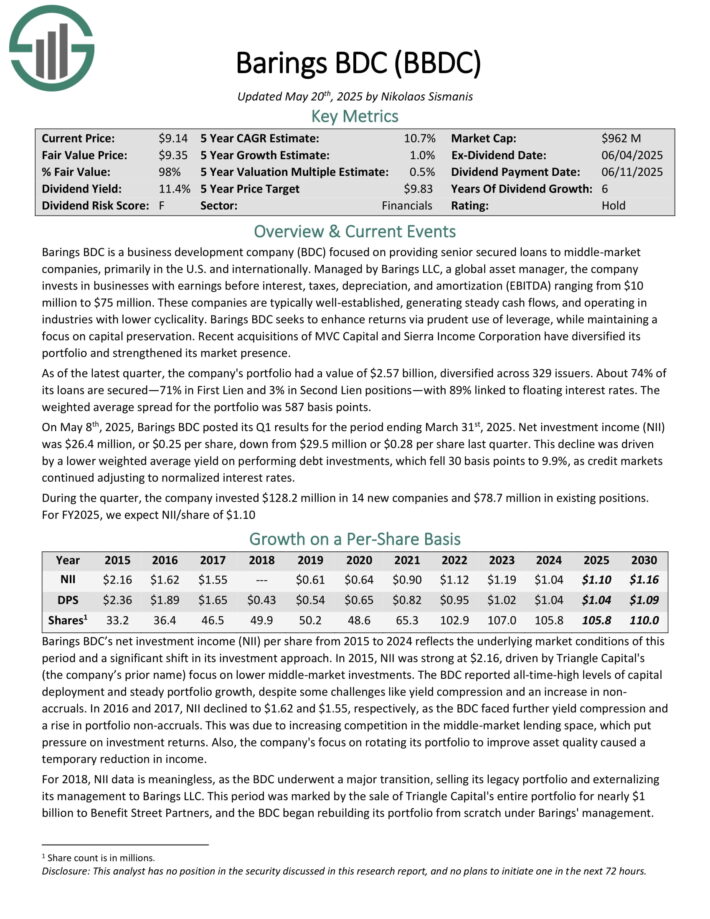
Barings BDC is a business development company (BDC) focused on providing senior secured loans to middle-market companies, primarily in the U.S. and internationally.
Managed by Barings LLC, a global asset manager, the company invests in businesses with earnings before interest, taxes, depreciation, and amortization (EBITDA) ranging from $10 million to $75 million.
As of the latest quarter, the company’s portfolio had a value of $2.57 billion, diversified across 329 issuers. About 74% of its loans are secured—71% in First Lien and 3% in Second Lien positions—with 89% linked to floating interest rates.
The weighted average spread for the portfolio was 587 basis points.
On May 8th, 2025, Barings BDC posted its Q1 results for the period ending March 31st, 2025. Net investment income (NII) was $26.4 million, or $0.25 per share, down from $29.5 million or $0.28 per share last quarter.
This decline was driven by a lower weighted average yield on performing debt investments, which fell 30 basis points to 9.9%, as credit markets continued adjusting to normalized interest rates.
Click here to download our most recent Sure Analysis report on BBDC (preview of page 1 of 3 shown below):
High Yield BDC #4: PennantPark Floating Rate Capital (PFLT)
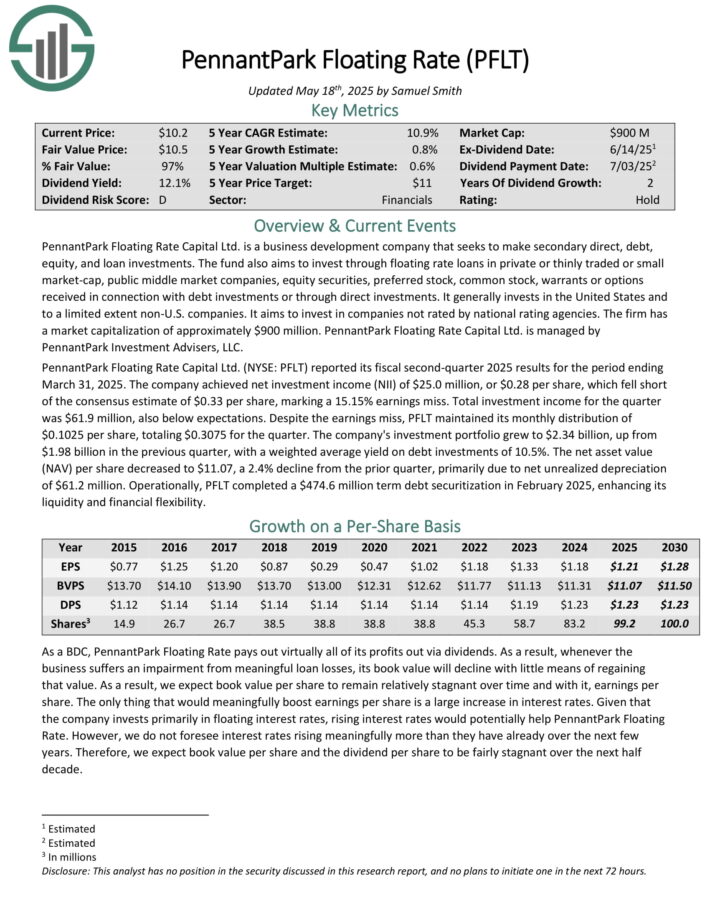
PennantPark Floating Rate Capital Ltd. is a business development company that seeks to make secondary direct, debt, equity, and loan investments.
The fund also aims to invest through floating rate loans in private or thinly traded or small market-cap, public middle market companies, equity securities, preferred stock, common stock, warrants or options received in connection with debt investments or through direct investments.
PennantPark Floating Rate Capital reported its fiscal second-quarter 2025 results for the period ending March 31, 2025. The company achieved net investment income (NII) of $25.0 million, or $0.28 per share, which fell short of the consensus estimate of $0.33 per share, marking a 15.15% earnings miss. Total investment income for the quarter was $61.9 million, also below expectations.
Despite the earnings miss, PFLT maintained its monthly distribution of $0.1025 per share, totaling $0.3075 for the quarter. The company’s investment portfolio grew to $2.34 billion, up from $1.98 billion in the previous quarter, with a weighted average yield on debt investments of 10.5%.
Click here to download our most recent Sure Analysis report on PFLT (preview of page 1 of 3 shown below):
High Yield BDC #3: Prospect Capital (PSEC)
Prospect Capital Corporation is a business development company, or BDC. It provides private debt and private equity to middle-market companies in the U.S. The company focuses on direct lending to owner-operated companies, as well as sponsor-backed transactions.
Prospect invests primarily in first and second lien senior loans and mezzanine debt, with occasional equity investments.
Prospect posted third quarter earnings on May 8th, 2025, and results were mixed once again. Earnings came to 19 cents, which beat estimates by a nickel. Earnings were off from 20 cents in Q2, and from 23 cents in last year’s Q3.
Total investment income, however, plummeted 16% year-over-year to $171 million, and missed estimates by almost $4million.
Total originations were $196 million, up from $135 million in Q2. Total repayments and sales were $192 million, down from $383 million in Q2.
Originations net of repayments and sales came to $5 million in Q3, up from -$248 million in Q2. Net originations quarter-to-date in Q4 were $45 million as of the earnings report.
Click here to download our most recent Sure Analysis report on PSEC (preview of page 1 of 3 shown below):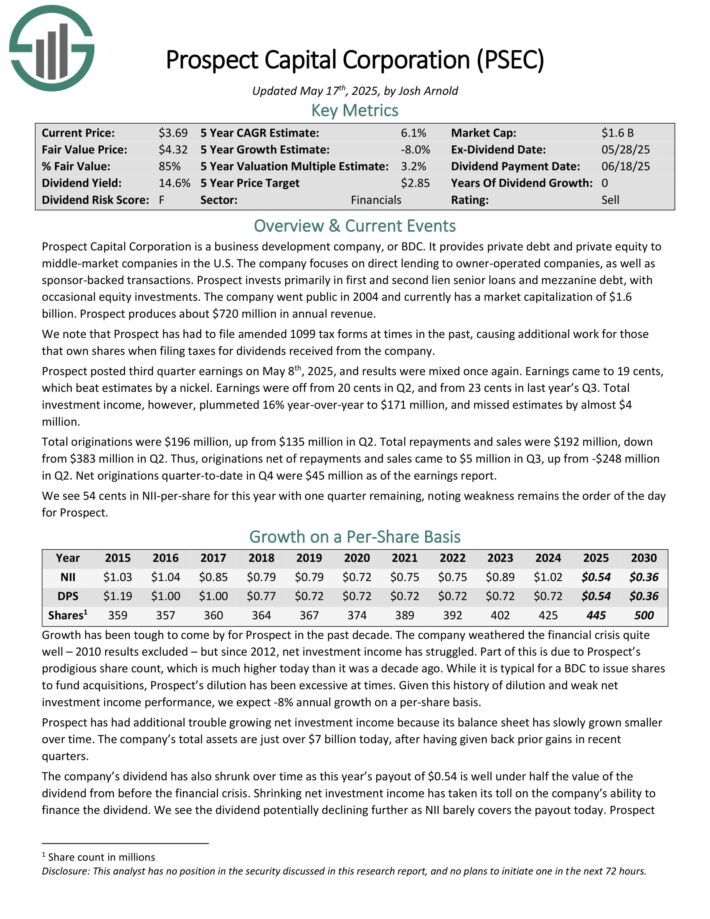
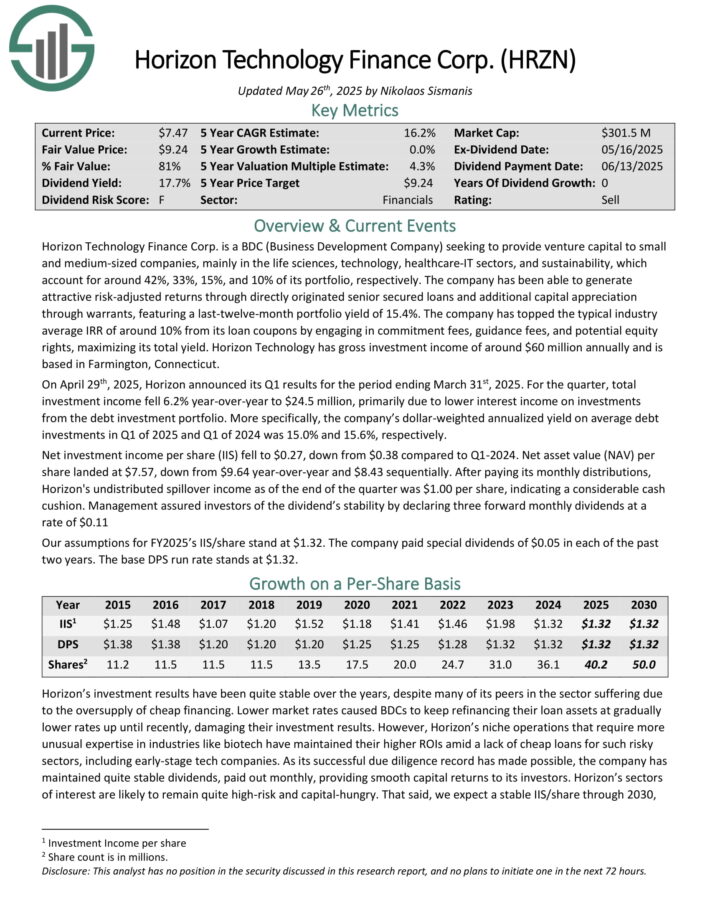
High Yield BDC #2: Horizon Technology Finance (HRZN)
Horizon Technology Finance Corp. is a BDC that provides venture capital to small and medium–sized companies in the technology, life sciences, and healthcare–IT sectors.
The company has generated attractive risk–adjusted returns through directly originated senior secured loans and additional capital appreciation through warrants.

Source: Investor Presentation
On April 29th, 2025, Horizon announced its Q1 results for the period ending March 31st, 2025. For the quarter, total investment income fell 6.2% year-over-year to $24.5 million, primarily due to lower interest income on investments from the debt investment portfolio.
More specifically, the company’s dollar-weighted annualized yield on average debt investments in Q1 of 2025 and Q1 of 2024 was 15.0% and 15.6%, respectively.
Net investment income per share (IIS) fell to $0.27, down from $0.38 compared to Q1-2024. Net asset value (NAV) per share landed at $7.57, down from $9.64 year-over-year and $8.43 sequentially.
Click here to download our most recent Sure Analysis report on HRZN (preview of page 1 of 3 shown below):
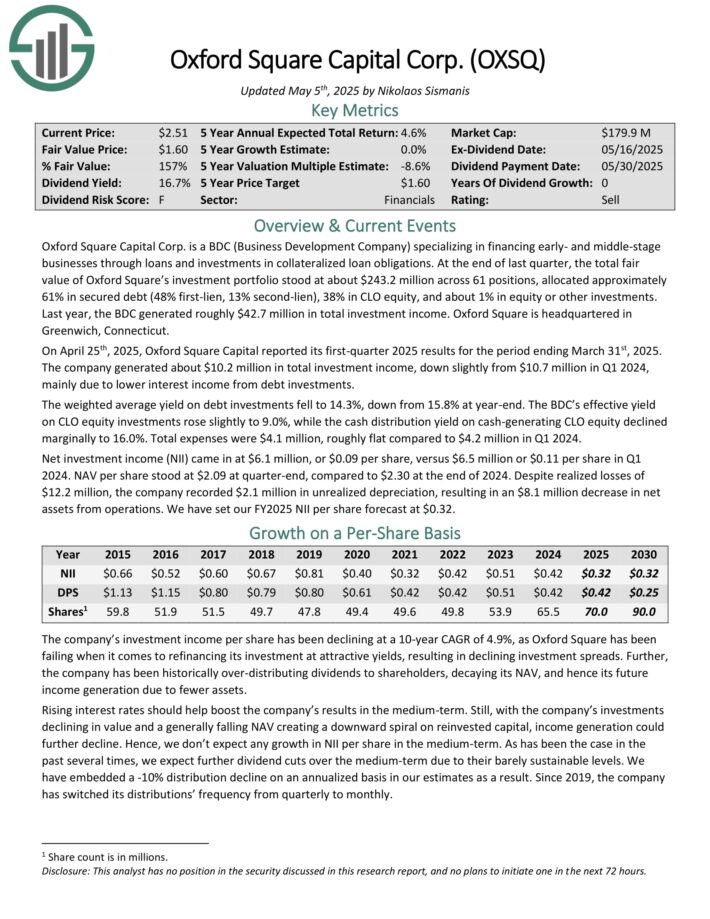
High Yield BDC #1: Oxford Square Capital (OXSQ)
Oxford Square Capital Corp. is a BDC (Business Development Company) specializing in financing early- and middle-stage businesses through loans and investments in collateralized loan obligations.
At the end of last quarter, the total fair value of Oxford Square’s investment portfolio stood at about $243.2 million across 61 positions, allocated approximately 61% in secured debt (48% first-lien, 13% second-lien), 38% in CLO equity, and about 1% in equity or other investments. Last year, the BDC generated roughly $42.7 million in total investment income.
On April 25th, 2025, Oxford Square Capital reported its first-quarter 2025 results for the period ending March 31st, 2025. The company generated about $10.2 million in total investment income, down slightly from $10.7 million in Q1 2024, mainly due to lower interest income from debt investments.
The weighted average yield on debt investments fell to 14.3%, down from 15.8% at year-end. The BDC’s effective yield on CLO equity investments rose slightly to 9.0%, while the cash distribution yield on cash-generating CLO equity declined marginally to 16.0%. Total expenses were $4.1 million, roughly flat compared to $4.2 million in Q1 2024.
Click here to download our most recent Sure Analysis report on OXSQ (preview of page 1 of 3 shown below):
Final Thoughts
Business Development Companies allow investors the opportunity to invest indirectly in small and mid-size businesses. And, BDCs have obvious appeal for income investors. BDCs widely have high dividend yields above 5%.
Of course, investors should consider all of the unique characteristics, including but not limited to the tax implications of BDCs.
Investors should also be aware of the risk factors associated with investing in BDCs, such as the use of leverage, interest rate risk, and default risk.
Further Reading
If you are interested in finding high-quality dividend growth stocks and/or other high-yield securities and income securities, the following Sure Dividend resources will be useful:
High-Yield Individual Security Research
Other Sure Dividend Resources
Thanks for reading this article. Please send any feedback, corrections, or questions to support@suredividend.com.

