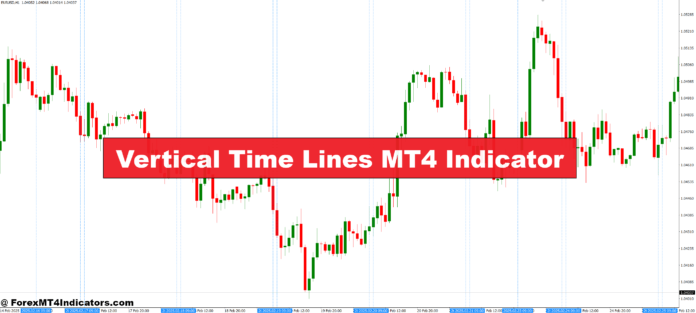
The Vertical Time Lines MT4 Indicator is a customizable chart tool that helps traders mark specific times directly on their MetaTrader 4 charts. These vertical lines act as visual guides, making it easier to track daily highs and lows, trading session starts, or news release times. Instead of manually drawing lines every day, traders can automate the process, saving time and improving consistency in analysis.
This indicator is beneficial for strategies that rely on time-based patterns, such as breakout trades during the London or New York sessions. By visually separating these periods, traders can quickly focus on the market conditions that matter most.
Benefits of Using Vertical Time Lines in Trading
One of the main benefits of this indicator is better time management during trading. By marking session start and end times, traders can plan their entries and exits more effectively. It also helps identify recurring market behaviors — for example, if a currency pair tends to spike at the start of the New York session, vertical time lines make it easier to spot that trend.
Another advantage is reduced chart clutter. Unlike constant horizontal lines that fill the chart, vertical lines are only visible at specific time points, making the chart cleaner while still providing essential timing information.
How Traders Can Use It Effectively

To get the most out of the Vertical Time Lines MT4 Indicator, traders should first decide which times are most relevant to their strategy. This could be session opens, daily candle starts, or times before major economic news. They can then adjust the indicator settings for line style, color, and frequency to match their chart preferences.
Many traders also combine vertical lines with other indicators, like moving averages or price action setups, to confirm trade signals. The key is to use these time markers as a supporting tool rather than a sole trading signal.
How to Trade with Vertical Time Lines MT4 Indicator
Buy Entry

Identify the start of a bullish trading session (e.g., London or New York) marked by a vertical line.
Confirm bullish momentum using supporting indicators such as moving averages or RSI above 50.
Wait for a bullish candlestick pattern (e.g., engulfing or breakout) to form after the vertical line appears.
Enter the trade at the close of the confirmation candle.
Set stop-loss just below the recent swing low.
Take profit at the next key resistance level or use a trailing stop to lock in gains.
Sell Entry

Spot the start of a bearish trading session or high-volatility period marked by a vertical line.
Confirm bearish momentum with other indicators, such as moving averages crossing downward or RSI below 50.
Wait for a bearish candlestick pattern (e.g., bearish engulfing or breakdown) after the vertical line.
Enter the trade at the close of the confirmation candle.
Set stop-loss just above the recent swing high.
Take profit at the next key support level or use a trailing stop for extended moves.
Conclusion
The Vertical Time Lines MT4 Indicator might seem like a simple addition to a chart, but it offers powerful benefits for time-based analysis. By clearly marking important trading moments, traders are kept organized, focused, and ready for opportunities. Whether used for session tracking or event reminders, this tool can help improve timing and overall trade execution.
Recommended MT4/MT5 Broker
XM Broker
Free $50 To Start Trading Instantly! (Withdraw-able Profit)
Deposit Bonus up to $5,000
Unlimited Loyalty Program
Award Winning Forex Broker
Additional Exclusive Bonuses Throughout The Year
Exclusive 90% VIP Cash Rebates for all Trades!

>> Sign Up for XM Broker Account here with Exclusive 90% VIP Cash Rebates For All Future Trades [Use This Special Invitation Link] <<
Already an XM client but missing out on cashback? Open New Real Account and Enter this Partner Code: VIP90


