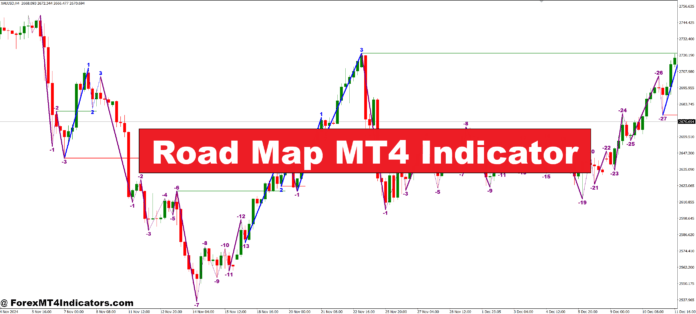
The Road Map MT4 Indicator is a custom tool designed to show key price levels, directional zones, and potential turning points in the market. It acts as a trading assistant, drawing horizontal and sloping lines that resemble a “road map” on your chart. These lines are based on historical price action and market behavior, helping traders make smarter, rule-based decisions. Whether you’re new to trading or experienced, this indicator brings clarity by highlighting where the price may react or reverse.
How It Works on the Chart
Once added to the MetaTrader 4 platform, the indicator overlays a series of calculated zones—often color-coded—for quick reference. It might display trend directions, support and resistance levels, and potential breakout areas. For example, when price approaches a key level shown on the map, traders can prepare for possible entries or exits. The visual structure helps reduce noise and simplifies the chart, making it easier to spot patterns and momentum shifts.
Why Traders Like Using It

Many traders appreciate the Road Map MT4 Indicator for its ease of use and clear visual feedback. It’s especially helpful for day traders and swing traders who want to avoid overcomplicating their setups. Instead of relying on five or six indicators, they use the road map as their base guide. It can work with most trading styles and timeframes. Best of all, it supports traders in staying disciplined by sticking to zones and levels rather than reacting emotionally to every candle.
How to Trade with Road Map MT4 Indicator
Buy Entry

Wait for the price to approach a support zone shown by the Road Map indicator.
Look for a bullish candlestick pattern (like bullish engulfing or pin bar) near or on the support line.
Confirm the trend direction is upward if the indicator shows rising support lines or a green zone.
Enter a buy trade once the price bounces from the support zone with strong bullish momentum.
Place a stop loss below the support zone or recent swing low.
Target the next resistance zone marked on the map as your take-profit level.
Sell Entry

Wait for the price to reach a resistance zone identified by the Road Map indicator.
Look for a bearish candlestick pattern (like bearish engulfing or shooting star) at or near the resistance line.
Make sure the trend direction is downward, confirmed by falling resistance lines or a red zone.
Enter a sell trade after price rejects the resistance zone with strong bearish momentum.
Place a stop loss above the resistance zone or the latest swing high.
Set your take-profit near the next support level on the map.
Conclusion
The Road Map MT4 Indicator is a practical, easy-to-understand tool for navigating the forex market. It gives structure to your analysis, highlights important price zones, and helps reduce guesswork. If you’re looking for a clean, visual way to plan your trades, this indicator might be your perfect guide. Try it out and give your trading strategy a clearer direction.
Recommended MT4/MT5 Broker
XM Broker
Free $50 To Start Trading Instantly! (Withdraw-able Profit)
Deposit Bonus up to $5,000
Unlimited Loyalty Program
Award Winning Forex Broker
Additional Exclusive Bonuses Throughout The Year
Exclusive 90% VIP Cash Rebates for all Trades!

>> Sign Up for XM Broker Account here with Exclusive 90% VIP Cash Rebates For All Future Trades [Use This Special Invitation Link] <<
Already an XM client but missing out on cashback? Open New Real Account and Enter this Partner Code: VIP90


